
AA: How Are Your Bots Doing?
If this is the first article you’re reading on my blog, then you’re probably confused.

If you are new to RPA, then welcome aboard the Automation Spaceship!
You might want to go through the first two articles in my 5-Star Developer Series before we active hyperdrive and blast off to infinity.
Why Perform Analytics on Bots?
By now you’ve probably realized just how transformative RPA can be to any organization which adopts it. Not only are they getting to save on FTEs, their employees can finally devote themselves to activities which require them to tap into their creative sides, before their clients taps them out with a barrage of requirements.
-Sun Tzu
Useful as they are, bots come with few drawbacks.
When you deploy bots into production, it works without taking breaks until the task is done. While this is every organization’s dream employee, it still isn’t smart enough to take care of itself. No amount of AI or ML will make it smart enough to improve itself, which is why we have to rigorously monitor its activity.
How many hours does it take for the bot to perform this task in comparison to a single FTE?
Is there any value addition here or does it take more time?
How many Bots were developed by Bot_Creator_TCT, and what is the frequency of failure?
Do we need more Bot Creators or should we replace Bot_Creator_TCT with someone competent?
Who started crying in the office pantry all of a sudden?

so went to wash it off with some tears.
Its impossible to manually keep track of multiple bots and note down all the details necessary to judge and predict performance, which is why we use Analytics.
In addition to bots, Automation Anywhere also enables us to perform analytics on raw data it receives either from Bots developed to analyze data(more on that later) or from Tableau Connectors.
Analytics is a multi-disciplinary goliath built to improve business performance. All you have to do is provide data, either directly or by integrating it with the application you wish to analyze and it will do the rest for you.
We will look at how Automation Anywhere has decided to leverage it to their advantage.
But There is One Problem
Most of the cool Bot Insight features is restricted to Enterprise Edition users, so you must be wondering how I am going to explain the concepts to you without falling flat on my face.
If you were to peer into my mind, then you’d lose your mind.
I start writing before studying the subject.
This is how I learn – I jot down whatever little I know about a subject before discovering the gaps. I then do a bit of research and fill that gap with solid information before bandaging it with some memes.
In other words, I improvise.
I’ll gather the required information, take few screenshots from the internet, edit it in PowerPoint and stitch them together into what you are seeing right now.

Most, if not all of the screenshots were taken from Arjun Meda’s fantastic tutorial on Bot Insights, so make sure you visit that link and drop a like!
Now For The Main Course!
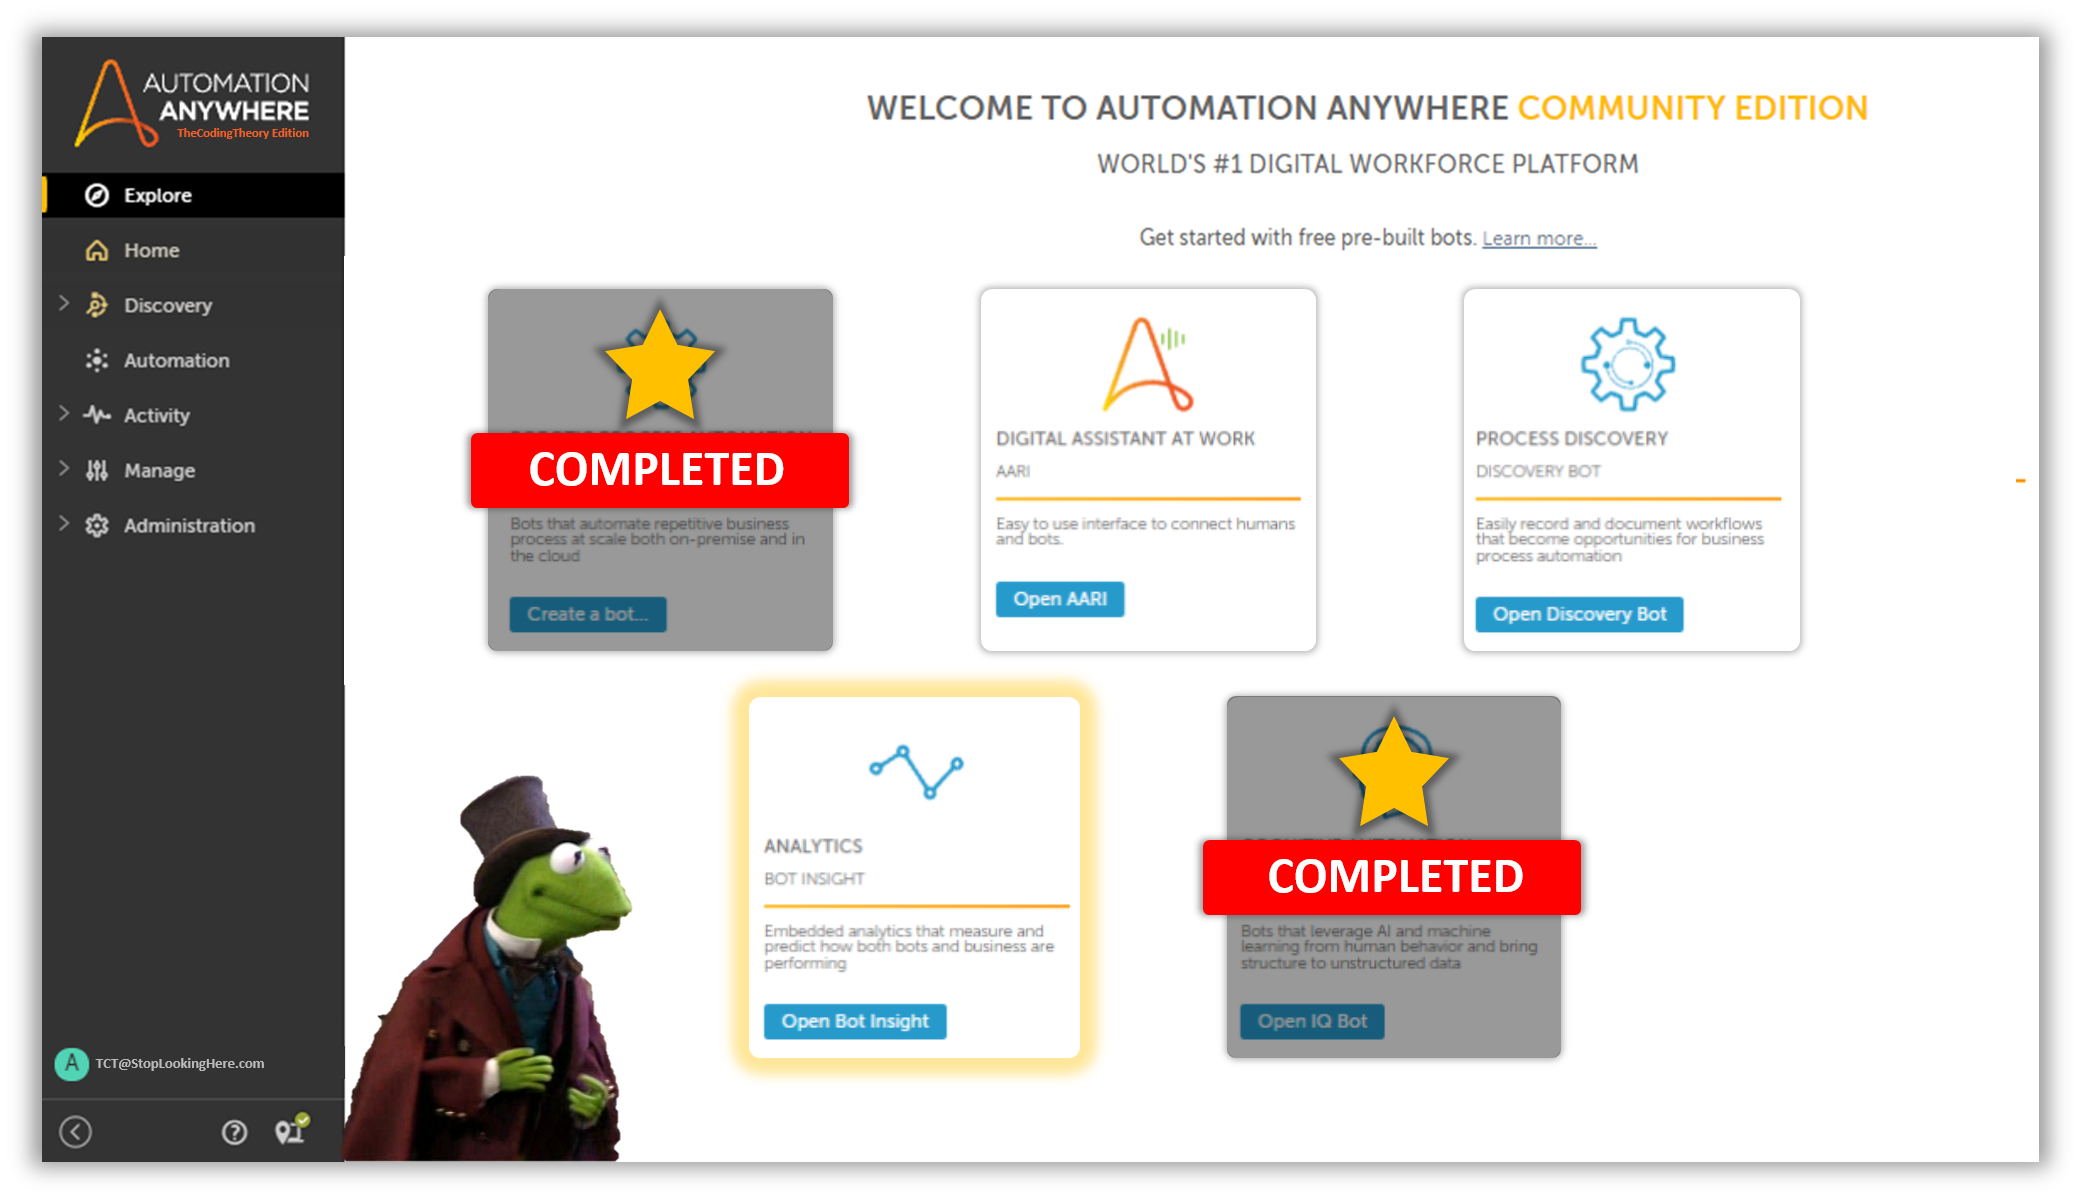
Bot Insight is divided into three areas:
Operational, Business Analytics along with AARI Dashboards which is the latest addition.
Before we can even even go into any of that, you must first have the permissions required to access this page.
By default, all users can view the Dashboard, but to edit it you require either the Bot Insight Consumer, Bot Insight Expert or Bot Insight Admin role mapped to your user. There are a couple of nuances, and you will have to assign the roles depending upon how you wish to impose restrictions.
You can read more here.
Free Operational Insights
The Operations Section contains three sections, two of which are available to us.
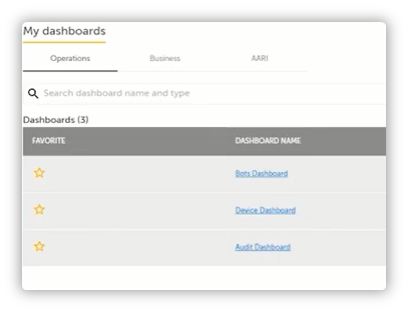
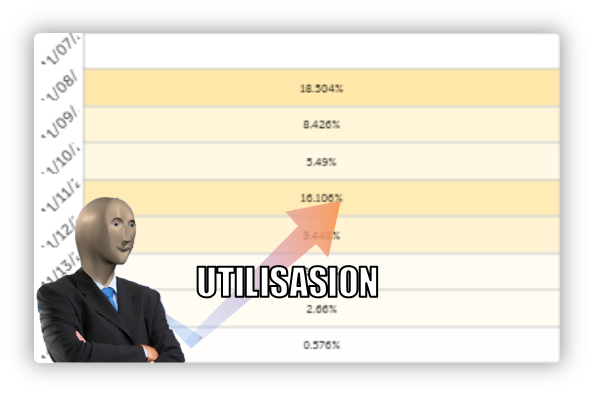
The Device Dashboards consists of all the machines currently registered with Automation Anywhere – which all are online/offline or have been schedules, its utilization, duration, history etc. all of the good stuff which lets you to keep track of machines.
Using this dashboard, it because easier for us to schedule bots. There is a Heatmap which gives us a clear picture of which machines are occupied throughout, and which aren’t.
If one of the machines is only being utilized during the day and remains inactive through the rest of the day, that means we can squeeze some bots in there and get more work done.
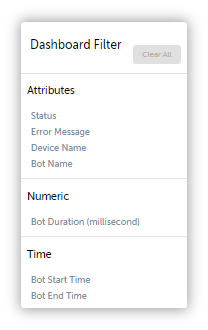
The Bots Dashboard is what we use to keep track of the bots activities, how many runs were successful, how many weren’t, reason for failure, how many are still in progress for a given date range.
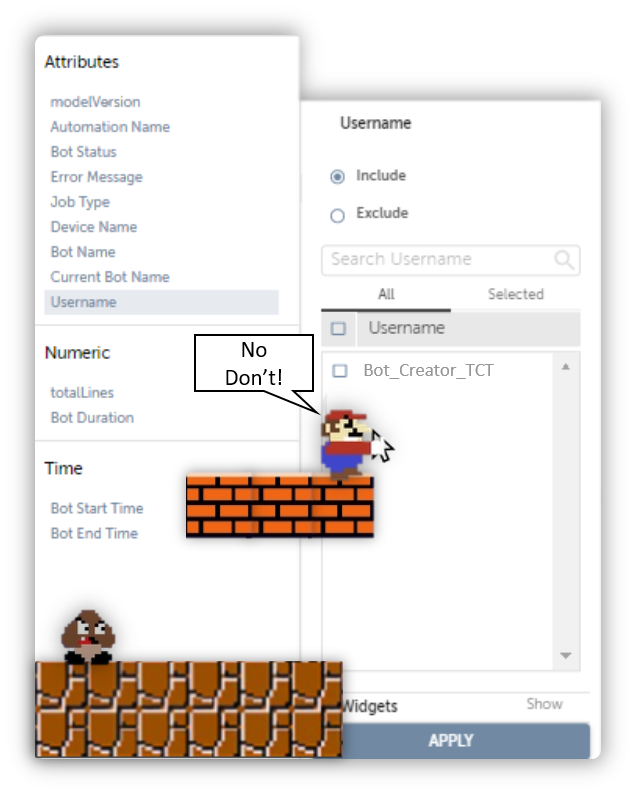
It also lets you to drill down and analyze bots developed by individual bot creators(gulp*).
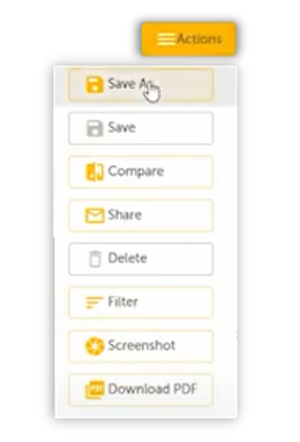
Once you are satisfied with your analytics, you can then export it either as Screenshot, PDF or compare it with other dashboards.
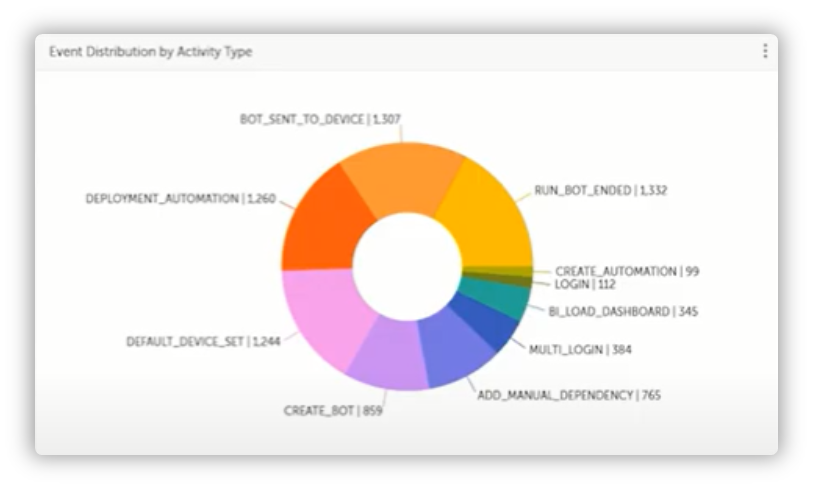
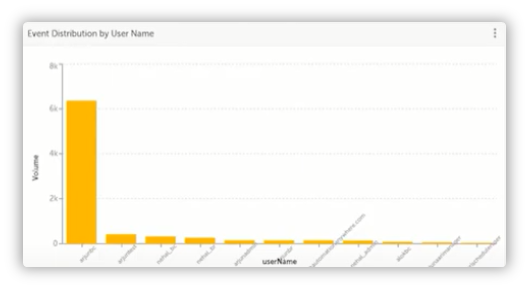
The Audit Dashboard provides insights into user activities, or “events” in the Control Room.
Again, you can drill down to users and check “which” users were responsible for “what” events.
Not-So-Free Business Insights
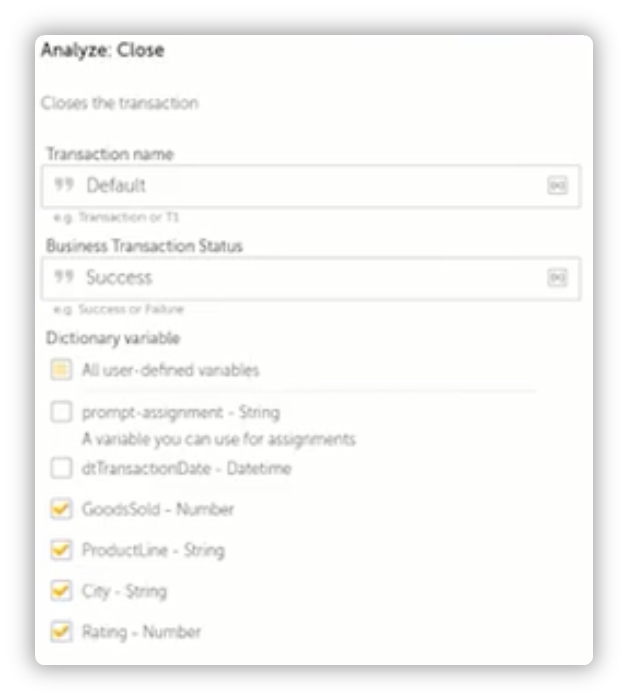
Data that you wish to perform analytics onto has to be feed into the Business Dashboard, and that is done by creating a Bot and tagging the values you want to populate the dashboard with using the Analyze Action Package.
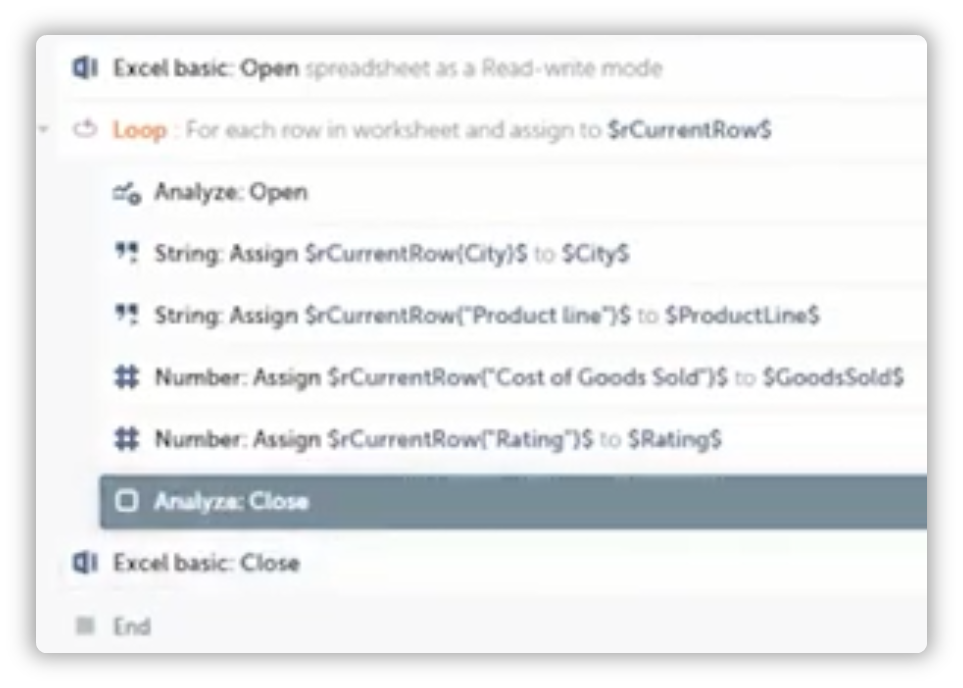
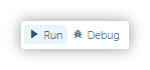
All that’s left is to Run and press Analyze once the bot finishes execution.
Once you hit Analyze, a new tab will open which will redirect you to the Bot Insights Business Dashboard.
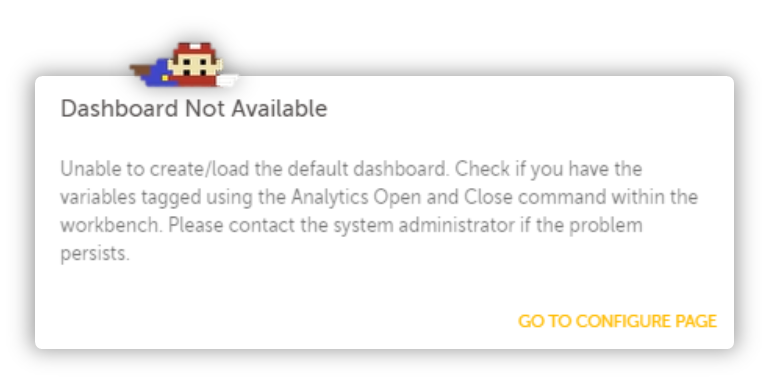
If you are working with Community Edition, this is the message you will receive.
Alright, so this is where I start improvising.
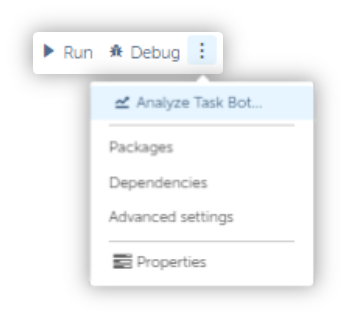
The Business Dashboard will automatically arrange your data into predefined templates, which you can change by heading over to the ellipses icon on each section and hit Settings.
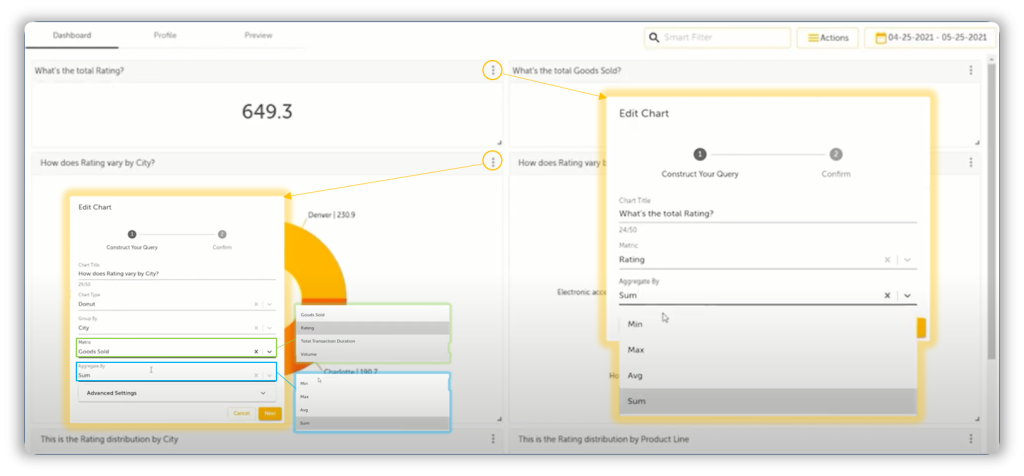
Don’t want to aggregate by Sum? Just switch it.
Don’t like the title? Just change it.
Don’t feel like configuring it today?

In addition to that, you can also drill down into the bar charts by right clicking and selecting the option you want to drill down into.
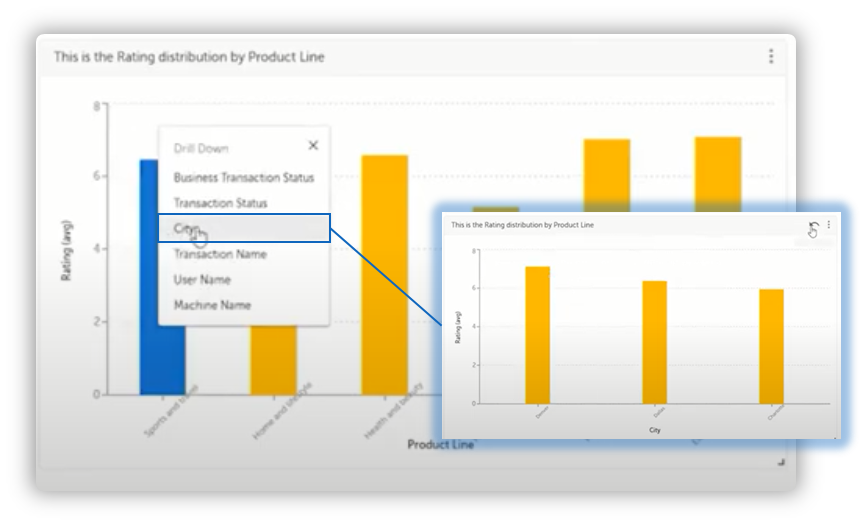
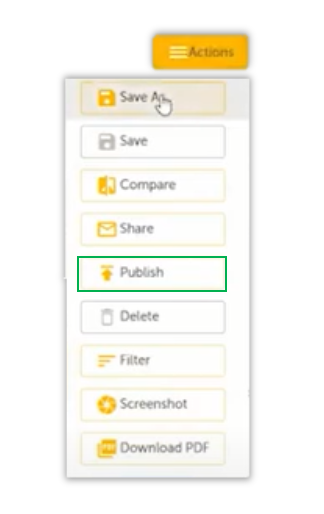
And just like with the Bot Dashboard, you can export it and also Publish it. That option was not available in the Bot Dashboard.
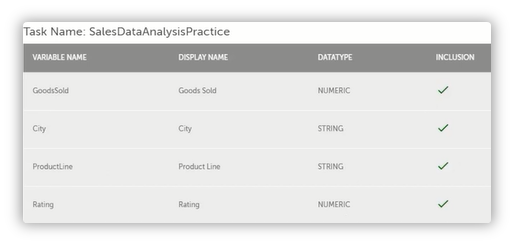
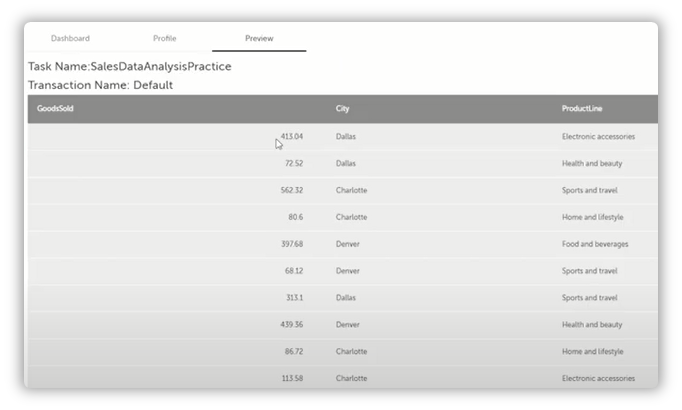
The Business Dashboard also contains a Profile and Preview, both of which provide additional insights into the variables which were tagged with the Analyze Package along with the transaction details.
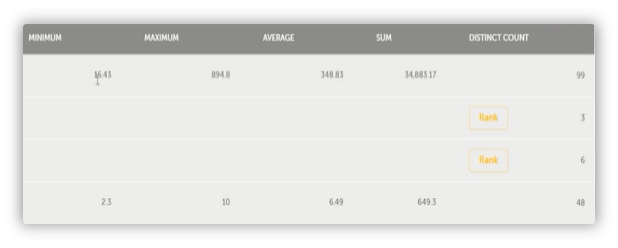
The Preview Tab lets you view the actual values where were feed into the dashboard from the bot.
Now, lets march into the final segment of Bot Insights,
AARI Dashboards
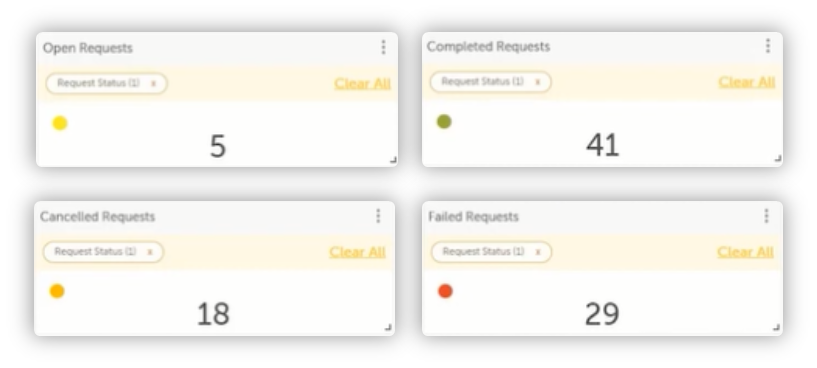
The AARI Dashboard keeps track of the Requests which are open, closed, in progress or failed. This only applies to AARI, so don’t get your knickers in a twists if you can’t find any “requests” under Forms or Bots!
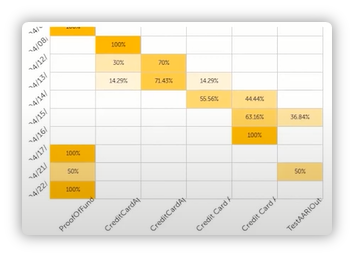
Also, it is very much similar to the Devices dashboards in that there is a Heatmap which keeps track of the requests which were created during a given interval which is provided in the date picker present next to the Actions button.
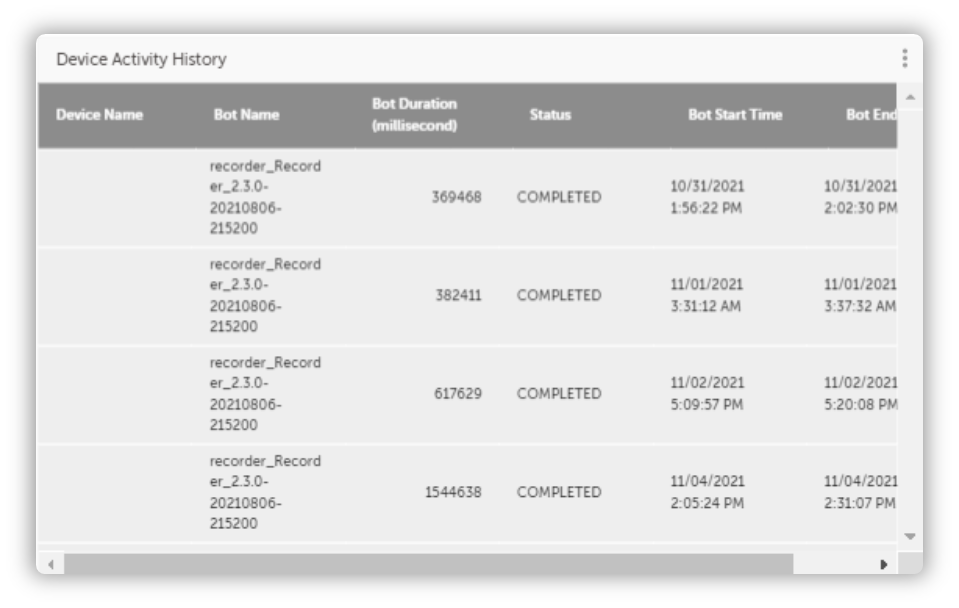
And just like the Bot Dashboard, there is also an Activity History section which keeps track of all requests, their statuses, their ids etc. This too can be saved like all the other dashboards.
Fin
And that concludes our shoooooort introduction to Bot Insights.
This article is only 1350 words but it seems long because of all the images I jammed into it.
I’ll try to shorten it next time, promise!